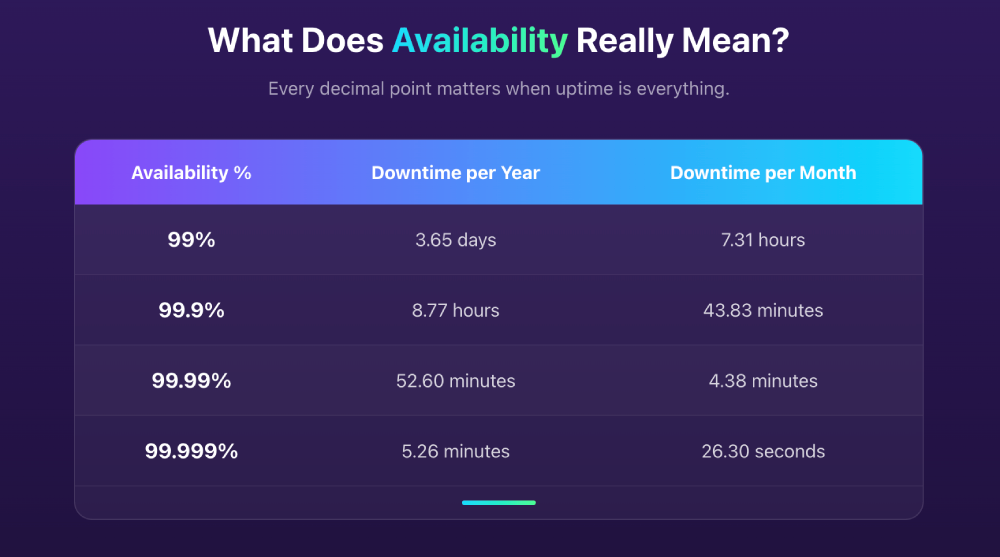
In the world of managed services, the “five-nines” availability (99.999% uptime) is often hailed as the gold standard of reliability. It is a target that leaves virtually zero room for error, requiring a system to be operational for all but a measly 5 minutes and 15 seconds per year.
For most businesses, this mark is unachievable and the reality is much more stark. Downtime is not a rare event, but a persistent issue. Research from Dunn & Bradstreet reveals a startling trend among industry leaders: 59% of Fortune 500 companies experience a minimum of 1.6 hours of downtime every single week (1). When you consider that these are the organizations with the deepest pockets and most robust tech stacks, it becomes clear that no one is immune.
The numbers for smaller organizations are just as sobering. According to the consulting firm IDC, 80% of small businesses have dealt with unplanned outages in their history. These aren’t just one-off events, for many, it’s a recurring headache with an IBM study showing 79% of organizations reporting unplanned downtime at least every two months (2).
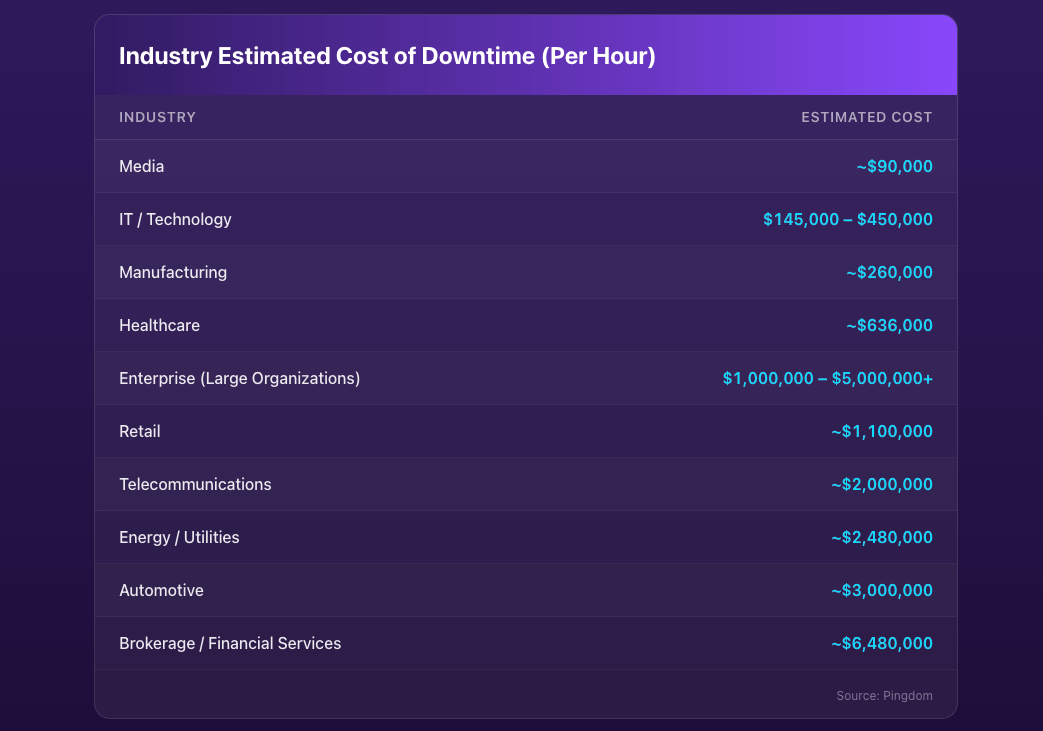
In today’s market, that time is incredibly expensive:
- Larger Companies: The average cost of downtime is $9,000 per minute (3).
- Small Businesses: Costs land in the range of $137 to $427 per minute (4).
Use Our Cost of Downtime Calculator
What Is the True Cost Of Downtime?
When most people think about downtime, they immediately think of a website being down, software crashing, or a power outage that brings the office to a standstill. Naturally, the first costs that come to mind are the stagnant employees and the customers who simply can’t buy from you. However, these disruptions are only part of a much larger financial picture.
To understand the full scope of risk, the cost of downtime is generally categorized into five pillars: lost revenue, lost productivity, operational costs, recovery costs, and intangible impacts like reputation and legal fallout.
1. Lost Revenue
The most direct hit is the money you stop making the moment systems fail. For an e-commerce site, this is 100% of their income. For a brick-and-mortar business, it might be the inability to process credit cards or access inventory systems.
Beyond immediate transactions, your sales team loses the ability to close active deals, and the process of fostering new leads grinds to a halt. This creates a stagnant pipeline where the “time-to-money” increases, creating a cash flow strain and a cost of waiting for revenue that impacts the business long after systems are restored.
2. Lost Productivity
When systems are down, salaries don’t stop. When calculating lost time, you must factor in base wages plus 15% to 20% for benefits.
3. Operational Expenses
Rent, utilities, and software subscriptions are still costing you money even if your team is sitting idle because they can’t log in.
4. Recovery Costs
The recovery process itself often carries a significant price tag. You must account for the immediate and long-term expenses required to restore your environment to its full operational state:
- New Hardware: If the downtime was caused by server failure or equipment damage, you may be facing the high cost of physical hardware replacement.
- External Contractors: Resolving complex technical issues often requires hiring outside consultants or specialized data recovery services at high hourly rates.
- Overtime Wages for Employees: Getting systems back online frequently requires your internal IT team to work late nights or weekends, leading to unexpected overtime expenses.
- Value of Lost Data: Beyond just restoring the systems, there is a tangible cost associated with any data that was permanently lost or corrupted during the incident.
5. Intangible & Regulatory Costs
An outage often causes lasting damage to public perception and customer loyalty. Unplanned downtime can even diminish shareholder value, with stock prices potentially dropping by as much as 9% after a single incident, often taking nearly three months to recover (5). For highly regulated sectors like healthcare and finance, these outages can trigger government fines, litigation, or legal settlements. Additionally, if your business operates under contracts with uptime guarantees, downtime may force you to pay out expensive SLA financial penalties or provide service credits to impacted clients.
How to Calculate the Cost of Downtime (The Formula)
If you prefer to skip the math, you can jump to our downtime cost calculator. Just plug in your numbers and get an instant breakdown of the cost of your downtime.
Step 1: Estimate Lost Revenue per Hour (RLPH)
- Direct Revenue Lost: (Annual Revenue / 52 weeks) / weekly hours of operation
- Sales Revenue Lost: (Quarterly Sales Goals / 12 weeks) / total weekly hours of sales team
Complete Formula:
((Annual Revenue / 52 weeks) / weekly hours of operation) + ( Quarterly Sales Goals / 60)
Ex: (($5M / 52) / 40) + ($300k / 60) = $7400 per hour
Step 2: Calculate Lost Productivity per Hour (LPPH)
- # of employees * (avg hourly wage + benefits (15% of hourly wage) ) * avg % of dependency on uptime
Ex: 50 * ($25 + $3.75) * .75 = $1078 per hour
Step 3: Add Recovery Costs
- Hardware + Data Recovery Services + Overtime Wages
Ex: $5000 + $3000 + $1800 = $9800
Step 4: The Intangible Costs
Reputation Damage
- Customer churn (recurring revenue loss)
- 29% of Global executives revealed they lost customers after downtime (6)
- PR & Marketing Efforts to regain trust
- Takes 6-12 months and in extreme cases 12-24 months at $5000+ per month to regain reputation (7/8)
- Regaining lost market share requires $1.85 for every $1 of spend (9)
SLA Penalties
- Usually a service credit of 5-10% of monthly fees with cap at 100% monthly fees (10)
- Note: Lawyers are pushing for higher fees as many businesses find this agreement inadequate
Regulatory Fines and Legal Fees
- Outages in regulated industries can trigger a cascade of litigation and government fines that average $22M annually for large firms (11)
Downtime Cost Calculator
Why MSPs Are Moving to Bare Metal Cloud for Disaster Recovery
For years, public cloud has been the default choice for disaster recovery. It offered fast deployment, flexible scaling, and relief from managing physical hardware. But
How MSPs Can Grow Revenue & Increase Profit Margin in 2026
While the managed services industry continues to show double-digit growth, most MSPs aren’t feeling it. Over half are growing under 10%, and one in five
When Should a Disaster Recovery Plan be Tested
Having a disaster recovery (DR) plan is only the first step in protecting your company from data loss and ensuring business continuity in the presence